
Are you searching for Vardhaman Textile share price targets then you are in the right place in this blog post I am going to analyze Vardhman Textiles Ltd. share Price based on its fundamentals and technical. after reading this post you will get full information about the company.
Vardhman Textiles Ltd., the company is a prominent player in the Indian textile and yarn manufacturing industry, has garnered attention from investors seeking to understand the company’s financial health and performance. In this detailed article, we will understand various aspects of Vardhman Textiles Ltd., including its share price target, ratio analysis, dividends, stock price trends, news impact, concall transcripts, investor presentations, promoters, and shareholders.

The Pulse of Investment
Investors are well aware that the share price of Vardhman Textiles Ltd. is a critical factor to consider before making investment decisions. This metric essentially reflects the market’s perception of the company’s performance.
The major investors in the company are promoters holding 64.07% increased stake from 63.85% which reflects that promoters believe that the company will do well in the future.
FII and DII holdings in the company are 6.85% and 16.95% which indicates that smart money trusts the future growth of the company.
Public holding in the company is 12.33% which is less than 20% which is good.
The stock price is impacted by various factors, such as market sentiment, financial performance, and overall economic conditions. Therefore, it is crucial for investors to carefully analyze the stock price movement over a specific period to make well-informed investment decisions.
Fundamental Analysis of Vardhman Textiles Ltd.
| Market CAP | 11,330.05 |
| No. Of shares | 28.91 Cr. |
| EPS | 19.62 |
| PE | 19.98 |
| PB | 1.37 |
| ROE | 24.57% |
| Dividend yield | 0.89% |
| Cash | 115.95 Cr. |
| DEBT | 1980.31 Cr. |
| Sales Growth | 58.38% |
| Profit Growth | 357.39% |
| CAGR | 19.6% |
PE ratio of the company is 19.97 which indicates that the stock is now overvalued. The PE ratio is used to determine for every rupee of a company’s earnings how much an Investor is ready to pay for the share.
Return on Assets (ROA): The ROA of the company is 17.08 % which is good. It is used to measure how efficiently a company can convert the money used to purchase assets into net income or profits. A higher ROA is good for the company.
Current Ratio: The current ratio of the company is 3.04 which measures a company’s ability to pay its short-term liabilities with its short-term assets. Higher is better.
Return on Equity: The ROE of the company is 24.57% which is good for investors. It is used to measure the company’s ability of a firm to generate profits from its shareholder’s investments in the company.
Sales growth: Sales growth is key success of the company and the company shows sales growth of 58.38/5 which is fear in relation to its growth.
Profit Growth: The profit growth of the company is 357.39% for the last year. They generated good profit in the last year.
Vardhman Textiles Ltd. Balance Sheet
Financial Stability
The balance sheet of Vardhman Textiles Ltd. provides a comprehensive view of the company’s financial standing by presenting data on its assets, liabilities, and equity. Analyzing the balance sheet to gauge the company’s financial health is essential.
| PARTICULARS | MAR 2021 | MAR 2022 |
| Share capital | 57.52 | 57.77 |
| Total Reserves | 6080.99 | 7481.35 |
| Borrowings | 1296.60 | 7481.35 |
| Other N/C Liabilities | 279.55 | 267.75 |
| Current Liabilities | 1349.05 | 1848.12 |
| Total Liabilities | 9063.75 | 10576.05 |
| Assets Net Block | 3467.96 | 3435.69 |
| Capital WIP | 77.75 | 241.02 |
| Investments | 494.30 | 964.29 |
| Loans & Advances | 64.59 | 126.91 |
| Other N/C Assets | 175.89 | 190.89 |
| Current Assets | 4783.26 | 5617.25 |
| Total assets | 9063.75 | 10576.05 |
Vardhman Textiles Ltd.’s annual report offers a detailed overview of the company’s performance over the year. This comprehensive document encompasses financial statements, management discussions and analyses, and insights into corporate governance. Investors can conveniently retrieve and download the annual report from the company website, allowing them to acquire valuable insights into the company’s financial performance.
Vardhman Textiles Ltd. Dividend
With a track record of consistently distributing dividends to shareholders, Vardhman Textiles Ltd. is an attractive prospect for income-oriented investors. Analyzing the company’s dividend history provides crucial insights into its dividend policy. Furthermore, it is essential to examine the dividend payout ratio to ascertain the portion of the company’s earnings allocated to dividends.
| EX DATE | RECORD DATE | DIVIDEND % | AMOUNT | TYPE |
| 02 Nov 2021 | 05 Nov 2021 | 340 | 34 | Interim |
| 16 Sep 2021 | 18 Sep 2021 | 175 | 17.5 | Final |
| 18 Sep 2019 | 20 Sep 2019 | 175 | 17.5 | Final |
Vardhman Textiles Ltd. Price Chart Analysis
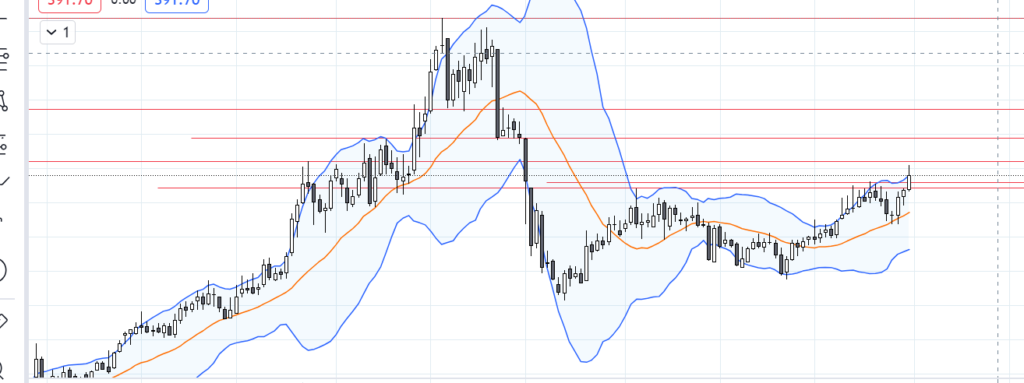
Vardhman Textiles Ltd. Monthly Price Chart
The price chart of Vardhman Textiles Ltd. offers a graphical representation of the stock price trends over time. By studying this chart, investors can gain valuable insights into the historical performance of the company’s stock.
To understand the trend of the stock is better to take a monthly chart which gives us a clear direction of the stock trend. So here I am going to take the monthly chart for analysis.
On monthly chart Vardhman Textiles Ltd. It breaks its 52-week high and moves uptrend which indicates that the stock has more potential to move in an uptrend the major resistance for the stock is 408. If the stock sustains above this level then Vardhman Textiles Ltd.’s first target is 436, second target is 470, and third target is 575.
The major support for Vardhman Textiles Ltd. Our first support is 385, second support is 360, and third support is 350.
Vardhman Textiles Ltd. Share Price Forecast/Target
Vardhman Textiles Ltd.’s Share price target for 2023 is a minimum of 377 a maximum is 440. and a target is 410.
Vardhman Textiles Ltd.’s Share price target for 2025 is a minimum of 395 and a maximum is 440. and target is 435.
Vardhman Textiles Ltd.’s Share price target for 2030 is a minimum of 469 a maximum is 597. and a target is 575.
Conclusion:
Vardhman Textiles Ltd. is a fundamentally good stock in the textile industry. the fundamentals and technicals of the company are looking attractive for investment. and the company is giving regular dividends to its investors. the promoter holding in the company is quite impressive. Now the company is breaking its 52-week high which indicates the can move further. so if you want to consider investment then it is best. so before investment consider market conditions and stock performance once. if you like this article pls share it with your friends and family and rate us.